Find Out About their Global Market Research and Data Analytics
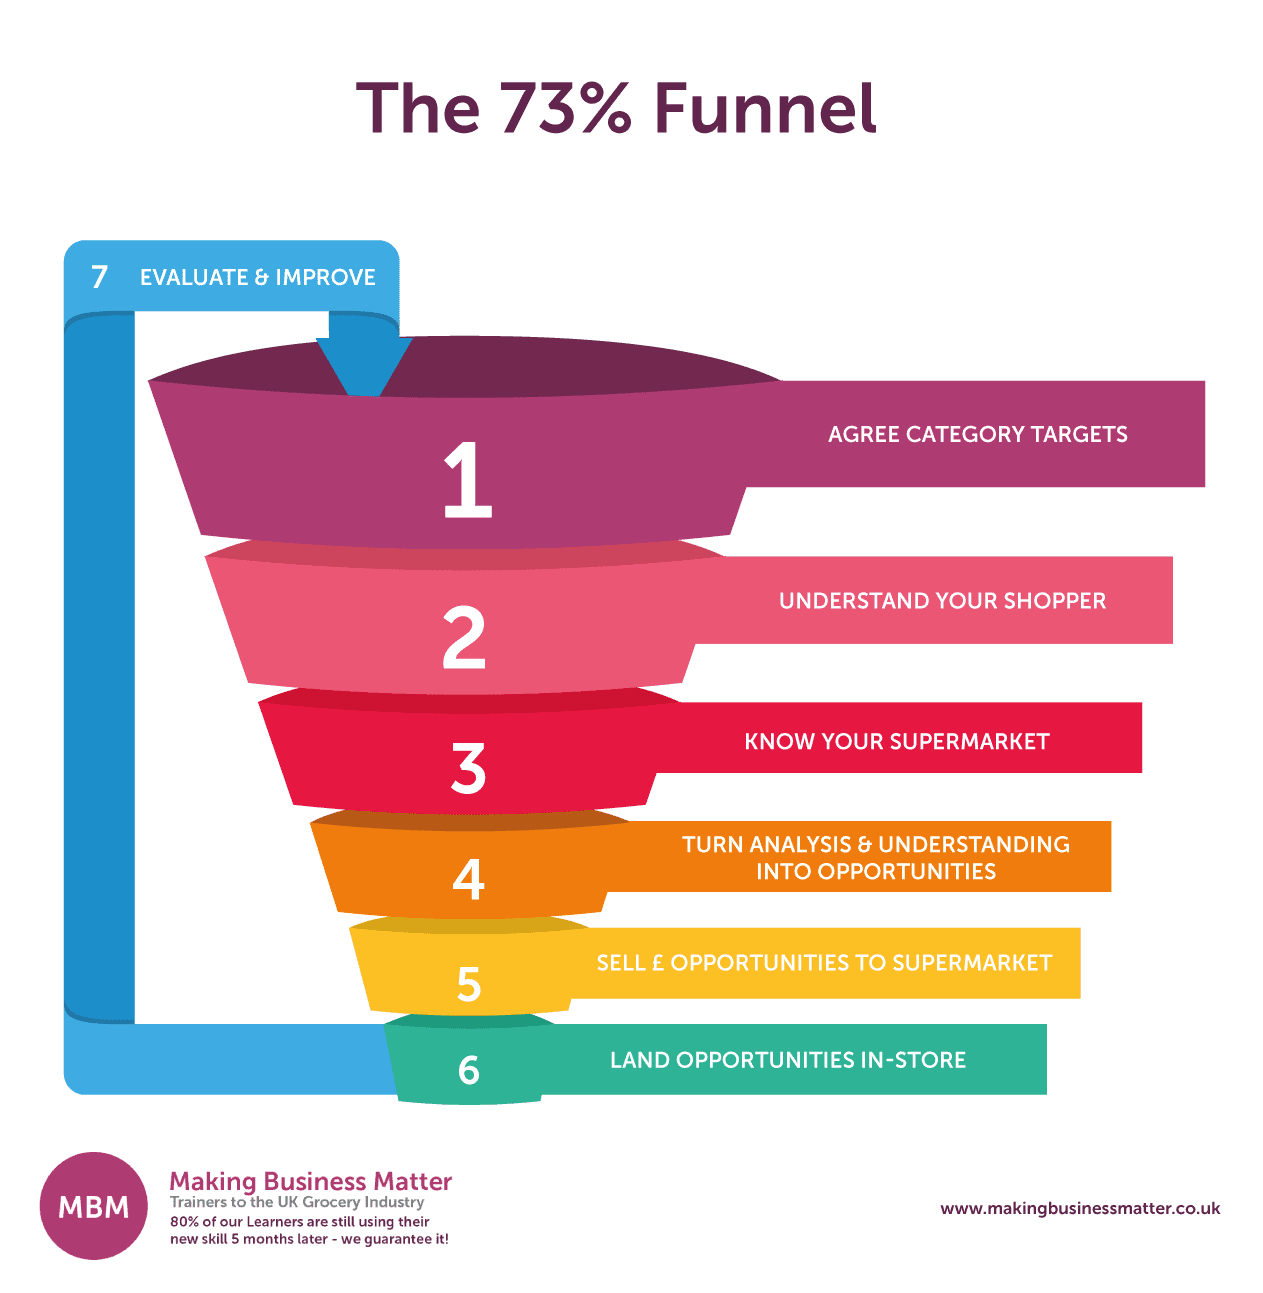
Nielsen generates revenue from its 2 major business units, ‘Watch’ and ‘Buy’. Data is at the core of the Category Management principles. Knowing which sources can give you what is key. For us at MBM, we see Category Management as essential.
We view it as a three-legged stool. It keeps the shopper, supermarket, and supplier at the heart of decision-making. We see it as a ‘business as usual discipline’ that maximises every stage of the process. The below article explores Nielsen Data, one of the many data sources available.
Table of Contents
- Nielsen Data Watch and Buy
- SCANTRACK Nielsen Data
- The Market Dimension
- The Product Dimension
- The Fact Dimension
- The Time Dimension
- Delivery frequency
- The Software
- Reporting
#1- Nielsen Data Watch and Buy
The ‘Watch’ side of the Nielsen data business tracks the number of people exposed to certain content and what actions they take afterwards. This is known as Reach, Resonance and Reaction. It delivers an understanding of who is viewing what content. Moreover, what it means to them and whether, or not, it leads to purchasing. This measurement is important for advertisers to understand where and when to advertise and to what audience.
The ‘Buy’ side of the business continuously tracks:
EPOS sales, through the major shopping channels. Scantrack delivers this. Plus…
Shopping behaviour, via a representative Panel of Households who record all of their Grocery purchases. The Nielsen product is called Homescan.
Below are 20 elements to help you better understand it, if you are Category Captain or a supplier wishing to add further value within your category:
#2- SCANTRACK Nielsen Data
Sticky Learning ® is 7 times more effective than 1-day training courses. Plus, you will get a Chain of Evidence proving your Return on Investment. Discover soft skills training that changes behaviours long term.

2A. The Market Dimension
- Understand what is being measured. The Universe is all the channels which Nielsen are representing in their numbers. So, typically, this would be a figure of 80-90% depending on the Category. Though the subscriber needs to understand the source of the sales that are included in the reported Nielsen numbers.
Typically, and depending on the category, it includes the following channels:
- Grocery Multiples – Tesco, Sainsbury’s, Asda, Waitrose, Morrisons, The Coop, M&S, Boots*, Superdrug*, Wilkinson’s, Booths etc.
- Impulse – Independents, Symbols, Forecourts, Off Licence’s etc.
- Chemists – Boots*, Superdrug*, Lloyds Pharmacy, Moss Pharmacy.
* The placing of Boots and Superdrug depends on the category.
These retailers will be included as Grocery Multiples for Healthcare categories. Items which consumers buy as part of a weekly shop, such as toothpaste or shampoo. For categories such as analgesics and cosmetics, Boots would compete with Chemists. Boots do have a major influence in this area and they also apply ‘masking rules’. This is to protect their market share in some cases and categories.
- How Suppliers Can Get the Most from Shopper Research.
- Purchase Decision Hierarchy/Shopper Decision Tree/Consumer Decision Tree/Customer Road Map – What do they mean?
- Trade Marketing Strategies to Increase Sales.
- Negotiation Skills: How to Prepare for a Negotiation with this 3-Step Template.
Excluded Channels
Conversely, the following are a few of the excluded channels:
- Department Stores
- Motorway Service Stations
- Hospital shops
So, of the 100% of sales of Cola in Great Britain, Nielsen represents, say, 85% of this. So 15% is not being measured (this is just a fictitious example and is not intended to be an accurate reflection of the Cola coverage).
- Census v Sample. For users of Nielsen data, it is important to be aware that most of the data inputs are census-based. This means that data comes from every store of that retailer. This, of course, means no projections/estimates are needed. It is 100% accurate in representing the whole retailer by the data coming in. Some inputs are ‘sample-based’. This means that projections are needed to represent the whole retailer. This data is not inaccurate but is the best estimate based on the data available.
Further Excluded Channels
- Subscription to Key Account Data (aka Named Account Data, or NAD, or KAD). The core offering from continuous data providers, such as Nielsen, is an aggregated service. This provides sales data, and derived facts. This is for the major channels such as Major Multiples, Chemists, and Impulse. It does not automatically break out the data by a retailer, as this is a royalty-based system. The fee is a separate revenue stream for both agency and retailer. So, account-specific data is available to buy for all major retailers. Also, many Impulse retailers and some Chemists. For Grocery suppliers, this is an investment that should be considered. It is standard practice to engage with retailers using their data.
Let us help you to get a higher ROI from the money you spend on data, with 121 Executive Coaching Support. Click on the carton below to see the options that are available (A new window will open):

- Fascia and Store Level data. An enhancement to Key Account data is the availability of fascia data e.g Tesco Express, Tesco Extra and Store Level Data. This is key for products which act differently, by store type.
2B. The Product Dimension
- Ensuring the Hierarchical database accurately reflects the client category. The continuous data information received from Nielsen is from one of two places. A bespoke database, built to the client’s specification. Or from a syndicated database which is a Nielsen defined view of the Category. In both sources, the database must reflect the category. It needs to be watertight for new products entering the market.
For example:
- Smoking may, for a long time, have fallen under Cigarettes, Cigars, and Tobacco. Following the innovation of Vaping, subscriber companies in this sector needed to review their view of the database. MBM can help with exploring the possibilities of this.
- Take Salty Snacks, should this include Pretzels? Do Pretzels compete in the same market as a bag of Cheese & Onion crisps?
2C. The Fact Dimension
- Basic Facts. The essential Facts, supplied by Nielsen, deliver an ongoing read of Value Sales, Volume Sales, Unit Sales and derived growth and share figures. These address the key questions for understanding the performance of any Brand, such as:
- How big is the market?
- Which segments are growing/emerging?
- How are the key manufacturers/brands performing?
- What are the opportunities?
- Distribution and Out of Stocks. It is important to first consider distribution when analysing sales results. This is because it helps to identify sales potential. If the product is not available there are no sales. Thus, the other measures (volume, price, promotion) do not matter.
- Identifying listing opportunities, by a retailer. This is one of the main uses of continuous data, along with an understanding of long-term trends. Tactical listing opportunities can be identified through an understanding of the Nielsen metrics available. Such as Rates of Sale comparisons between competing products. MBM can support clients in the interpretation of these numbers and the influencing of listing decisions.
Click the image below for a higher resolution.

- Interrogate performance of promotions. The cost of Promotions means that an understanding of their outcomes is essential. Nielsen provides standard Promotion metrics, such as Promotional Distribution and Incremental sales (versus expected sales). These find the uplift from a particular type of campaign. The learning enables suppliers and retailers to collaboratively employ mechanics which deliver the greatest return. More advanced analysis can deliver a more in-depth understanding of promotional elasticity, actual mechanics, and store by store performance.

Examining Promotional activity can answer:
- What % of my sales is on promotion?
- What % of my competitor’s sales is on promotion?
- Do my sales increase with a sales-driven promotion?
- Am I over-promoting or under-promoting?
- What promotions have been the most successful?
- Pricing. Understanding price points are essential for a sustainable successful brand. Average Price is a standard feature of Nielsen core data but can be further interrogated through multi-regression analyses which can deliver valuable learnings in areas such as Price Elasticity.
Price analysis can deliver answers to some very common questions:
- How is my price positioning against the competition?
- Is the pricing relationship of the items in my portfolio structured in the best way?
- Is the price gap to competition affecting my performance? Should I act?
- Has the change in price affected my performance?
- How am I performing within specific price segments?
2E. The Time Dimension
- Time Periods. The core service supplies 160 weeks of data as the raw material. This is used to build industry standard aggregates such as MAT (Moving Annual Total), YTD (Year to Date) and Latest 4 Weeks. Also, the client can create their bespoke periods such as ‘Fiscal YTD’ or ‘The Summer Season’.
2F. Delivery frequency
-
- Delivery frequency. Subscribers to Nielsen data should be aware that content can be delivered at any frequency that is right for their needs. Typically, clients with a larger budget would receive weekly updates, delivered 10 days after the period end. Whilst for those who work in categories that, perhaps, move less quickly, or are at an early stage of development the need might be 4 weekly, Quarterly or Annual.
2G. The Software
-
-
- Answers are the Brand name for the Nielsen software. It supplies and interrogates all the above content. Some clients may only receive reports, without the software, but, for those who do subscribe to Answers, MBM can support in the training and optimal usage of its functionality.
-
2H. Reporting
Automated reporting. Typically, Grocery clients would prefer to use their fixed resources on analysing and gaining feasible insight from the data available. Nielsen data is easy to extract and include in self-updating reports and charts. Furthermore, MBM can lend support to help reduce the time spent on these tasks.


